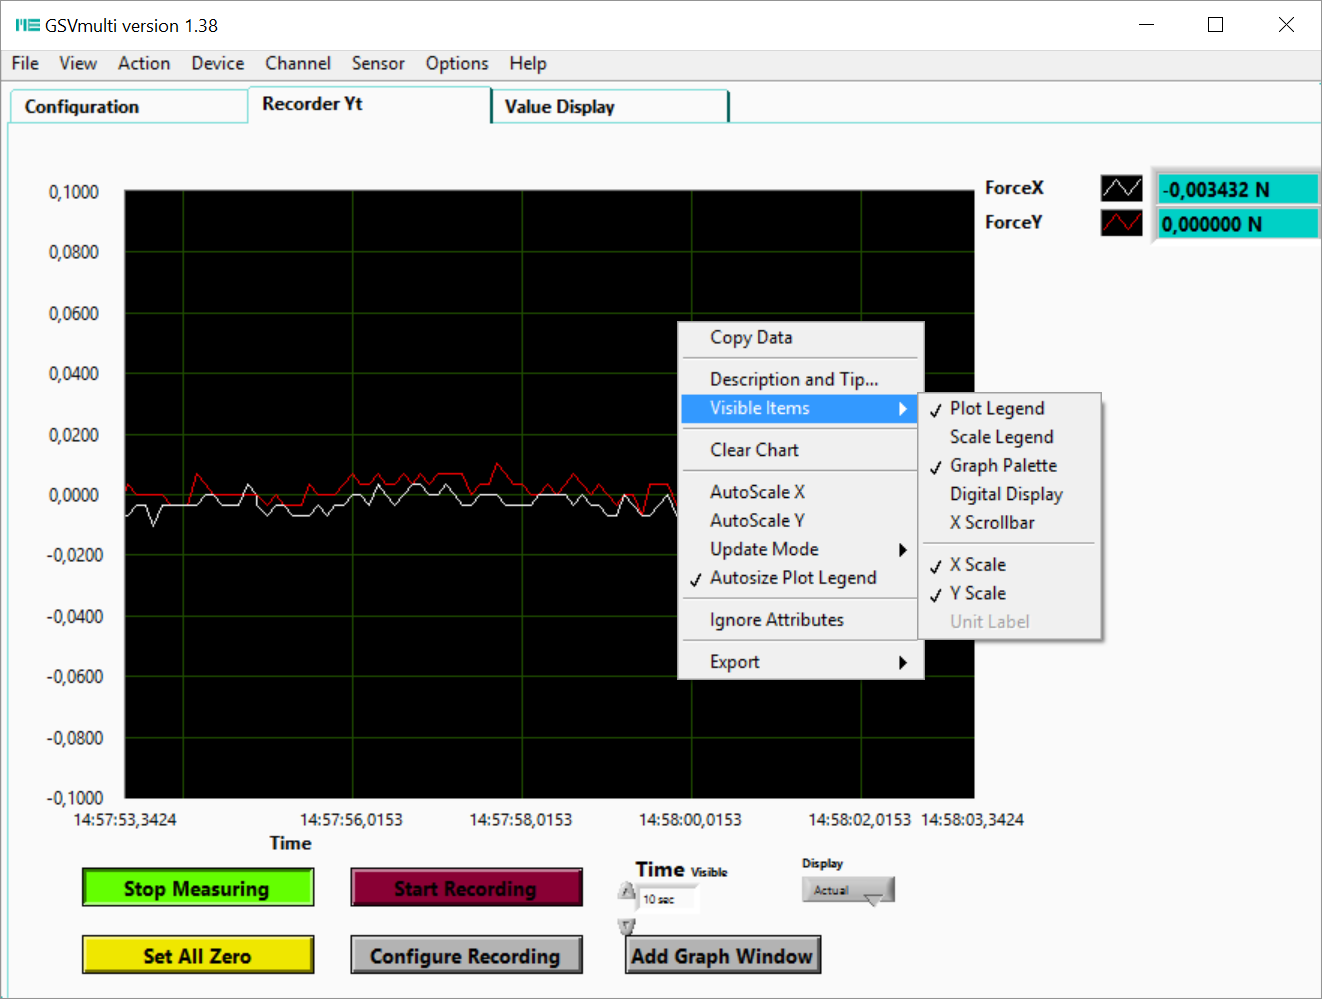
The numerical display on the right can be switched from "actual value display" to, for example, "maximum value display" (drag pointer function) or to the display of the noise amplitude.
The peak value of the noise amplitude is indicated, for example, by "Max-Min".
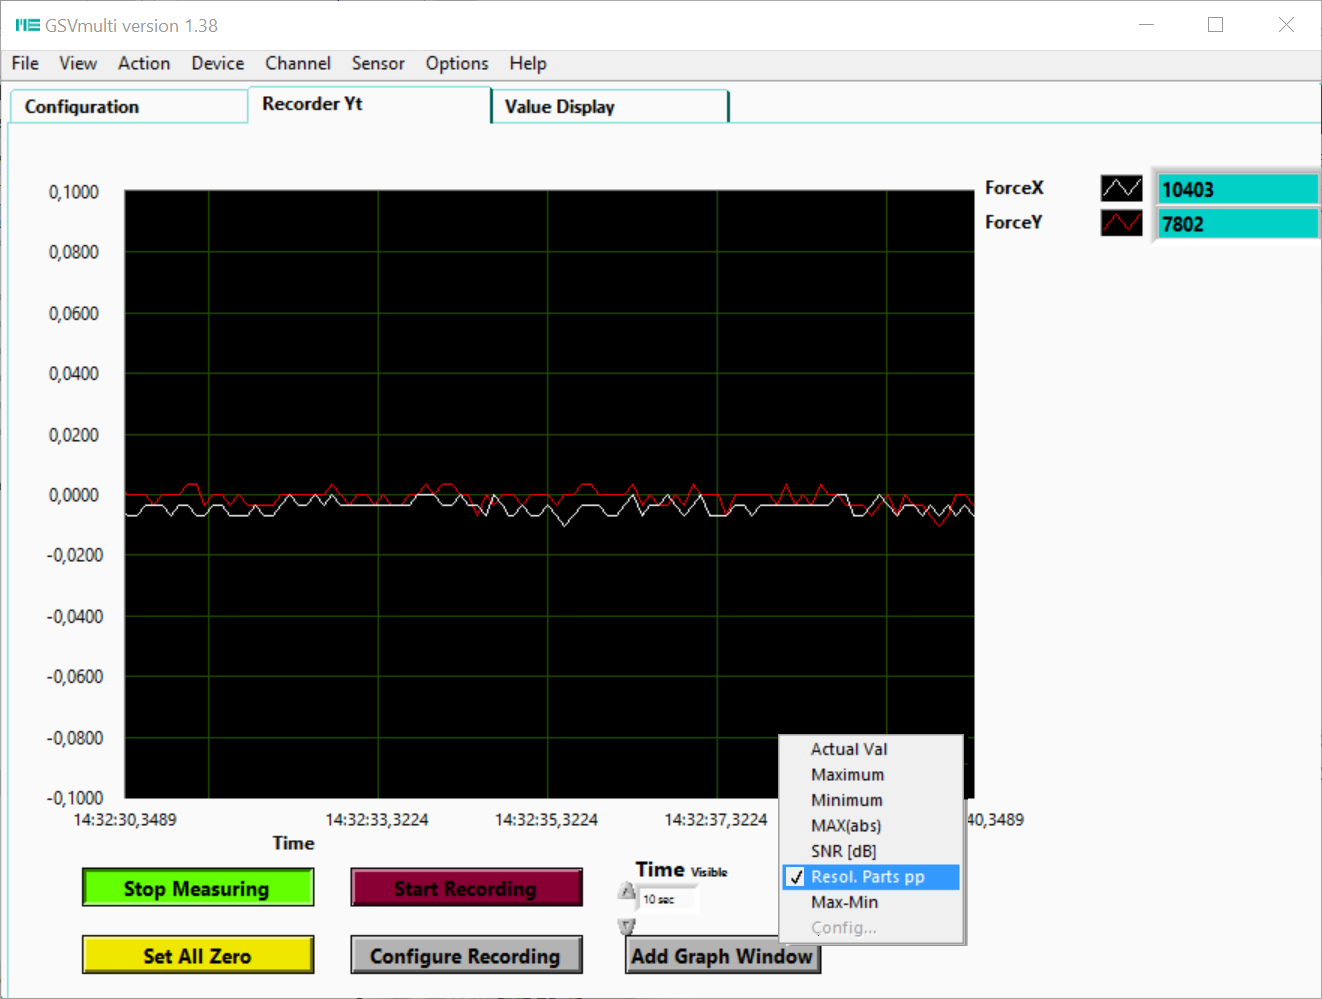
An illustrative measure for checking the signal-to-noise ratio is provided by the display of "Resol Parts pp" (display steps): In this example, the positive measuring range of "ForceX" is resolved in 10400 display steps.
The reading accuracy (resolution) of the 100N sensor is 100N/10400 = 0.01N.
The last 100 measured values are continuously used to calculate the noise amplitude. From a data frequency of 100Hz, all measured values from the last second are used.